Total renewable water resources: 1.78 cu km (2011)
Freshwater withdrawal (domestic/industrial/agricultural): 1.78 cu km (2011) Natural hazards: sandstorms may occur during spring and summer; droughts; periodic earthquakes
Environment - current issues: limited arable land and natural freshwater resources pose serious constraints; desertification; air pollution from industrial and vehicle emissions; groundwater pollution from industrial and domestic waste, chemical fertilizers, and pesticides
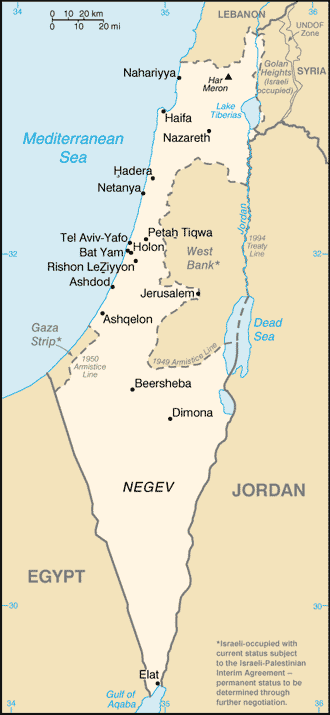
Geography - note: Lake Tiberias (Sea of Galilee) is an important freshwater source; the Dead Sea is the second saltiest body of water in the world (after Lake Assal in Djibouti); there are about 355 Israeli civilian sites including about 145 small outpost communities in the West Bank, 41 sites in the Golan Heights, and 32 in East Jerusalem (2010 est.)
Languages: Hebrew (official), Arabic (used officially for Arab minority), English (most commonly used foreign language)
Religions: Jewish 75.1%, Muslim 17.4%, Christian 2%, Druze 1.6%, other 3.9% (2012 est.)
Population: 7,821,850country comparison to the world: 99
note:approximately 341,400 Israeli settlers live in the West Bank (2012); approximately 18,900 Israeli settlers live in the Golan Heights (2012); approximately 196,400 Israeli settlers live in East Jerusalem (2011) (July 2014 est.)
Age structure: 0-14 years:27.1% (male 1,084,748/female 1,035,525)
65 years and over:10.5% (male 368,318/female 466,670) (2014 est.)
Dependency ratios: total dependency ratio:63.1 %
youth dependency ratio:45.5 %
elderly dependency ratio:17.6 %
potential support ratio:5.7 (2014 est.)
Median age: total:29.9 years
male:29.2 years
female:30.6 years (2014 est.)
Population growth rate: 1.46% (2014 est.)country comparison to the world: 84
Birth rate: 18.44 births/1,000 population (2014 est.)country comparison to the world: 101
Death rate: 5.54 deaths/1,000 population (2014 est.)country comparison to the world: 175
Net migration rate: 1.68 migrant(s)/1,000 population (2014 est.)country comparison to the world: 53
Urbanization: urban population:91.9% of total population (2011)
rate of urbanization:1.73% annual rate of change (2010-15 est.)
Major urban areas - population: Tel Aviv-Yafo 3.381 million; Haifa 1.054 million; JERUSALEM (capital) 791,000 (2009)
Sex ratio: at birth:1.05 male(s)/female
0-14 years:1.05 male(s)/female
15-24 years:1.05 male(s)/female
25-54 years:1.05 male(s)/female
55-64 years:1.01 male(s)/female
65 years and over:0.78 male(s)/female
total population:1.01 male(s)/female (2014 est.)
Mother's mean age at first birth: 27.3 (2011 est.)
Maternal mortality rate: 7 deaths/100,000 live births (2010)
Infant mortality rate: total:3.98 deaths/1,000 live birthscountry comparison to the world: 199
male:4.16 deaths/1,000 live births
female:3.8 deaths/1,000 live births (2014 est.)
Life expectancy at birth: total population:81.28 yearscountry comparison to the world: 19
male:79.05 years
female:83.61 years (2014 est.)
Total fertility rate: 2.62 children born/woman (2014 est.)country comparison to the world: 75
Health expenditures: 7.7% of GDP (2011)
Physicians density: 3.11 physicians/1,000 population (2011)
Hospital bed density: 3.4 beds/1,000 population (2011)
Drinking water source: improved:
urban: 100% of population
rural: 100% of population
total: 100% of population
unimproved:
urban: 0% of population
rural: 0% of population
total: 0% of population (2012 est.)
Sanitation facility access: improved:
urban: 100% of population
rural: 100% of population
total: 100% of population
unimproved:
urban: 0% of population
rural: 0% of population
total: 0% of population (2012 est.)
HIV/AIDS - adult prevalence rate: 0.2% (2009 est.)country comparison to the world: 104
HIV/AIDS - people living with HIV/AIDS: 7,500 (2009 est.)country comparison to the world: 115
HIV/AIDS - deaths: fewer than 100 (2009 est.)country comparison to the world: 120
Obesity - adult prevalence rate: 26.2% (2008)country comparison to the world: 49
Education expenditures: 5.6% of GDP (2011)country comparison to the world: 57 Literacy: definition:age 15 and over can read and write
total population:97.1%
male:98.5%
female:95.9% (2004 est.)
School life expectancy (primary to tertiary education): total:16 years
male:15 years
female:16 years (2009)
Unemployment, youth ages 15-24: total:12.1%country comparison to the world: 98
male:11.6%
female:12.7% (2012)
Government
Country name: conventional long form: State of Israel
conventional short form:Israel
local long form:Medinat Yisra'el
local short form:Yisra'el
Government type: parliamentary democracy
Capital: name:Jerusalem: note - Israel proclaimed Jerusalem as its capital in 1950, but the US, like all other countries, maintains its embassy in Tel Aviv
geographic coordinates:31 46 N, 35 14 E
time difference:UTC+2 (7 hours ahead of Washington, DC, during Standard Time)
daylight saving time:+1hr, begins Friday before the last Sunday in March; ends the last Sunday in October
Independence: 14 May 1948 (from League of Nations mandate under British administration)
National holiday: Independence Day, 14 May (1948); note - Israel declared independence on 14 May 1948, but the Jewish calendar is lunar and the holiday may occur in April or May
Constitution: no formal constitution; some functions of a constitution are filled by the Declaration of Establishment (1948), the Basic Laws of the Parliament (Knesset), and the Israeli citizenship law (2013)
Legal system: mixed legal system of English common law, British Mandate regulations, and Jewish, Christian, and Muslim religious laws
International law organization participation: has not submitted an ICJ jurisdiction declaration; withdrew acceptance of ICCt jurisdiction in 2002
Suffrage: 18 years of age; universal
Executive branch: chief of state:President Shimon PERES (since 15 July 2007)
head of government:Prime Minister Binyamin NETANYAHU (since 31 March 2009)
cabinet:Cabinet selected by prime minister and approved by the Knesset
elections:president largely a ceremonial role and is elected by the Knesset for a seven-year term (one-term limit); election last held 10 June 2014 (next to be held in 2021 but can be called earlier); following legislative elections, the president, in consultation with party leaders, assigns the task of forming a governing coalition to a Knesset member whom he or she determines is most likely to accomplish that task
election results:Reuven RIVLIN elected president in second round; number of votes in first round - Reuven RIVLIN 44, Meir SHEETRIT 31, Dalia Itzik 28, Dalia Dorner 13, other/invalid 3; number of votes in second round - Reuven RIVLIN 63, Meir SHEETRIT 53, other/invalid 3; RIVLIN will be sworn in 24 July 2014
Legislative branch: unicameral Knesset (120 seats; political parties are elected by popular vote and assigned seats for members on a proportional basis; members serve 4-year terms)
elections:last held on 22 January 2013 (next to be held in 2017)
election results:percent of vote by party - Likud-Beiteinu (combined for electoral purposes only) 23.3%, Yesh Atid 14.3%, Labor 11.4%, The Jewish Home 9.1%, SHAS 8.7%, United Torah Judaism 5.2%, The Movement 5%, The New Movement-Meretz 4.5%, United Arab List-Ta'al 3.6%, HADASH 3%, Balad 2.6%, Kadima 2.1%; other 7.2%; seats by party - Likud-Beiteinu 31, Yesh Atid 19, Labor 15, The Jewish Home 12, SHAS 11, United Torah Judaism 7, The Movement 6, Meretz 6, United Arab List-Ta'al 4, HADASH 4, Balad 3, Kadima 2
note:Ehud BARAK and four others on 17 January 2011 split from the Labor Party and formed the Atzmaut (Independence) Party; the Labor Party holds 8 seats in the Knesset and the Independence Party holds 5 seats; Aztmaut did not submit a candidate list for the election on 22 January 2013
Judicial branch: highest court(s):Supreme Court ( consists of the chief justice and 14 judges)
judge selection and term of office:judges selected by the Judicial Selection Committee, made up of all three branches of the government and chaired by the Minister of Justice; judges can serve up to mandatory retirement age of 70
subordinate courts:district and magistrate courts; national and regional labor courts; special and religious courts
Political parties and leaders: Balad [Jamal ZAHALKA]
Democratic Front for Peace and Equality (HADASH) [Muhammad BARAKEH]
Kadima [Shaul MOFAZ]
Labor Party [Yitzhak HERZOG]
Likud [Binyamin NETANYAHU]
National Union [Uri ARIEL]
SHAS [Eliyahu YISHAI]
The Jewish Home (HaBayit HaYehudi) [Naftali BENNETT]
The Movement (Hatnuah) [Tzipora 'Tzipi' LIVNI]
The New Movement-Meretz [Haim ORON]
United Arab List-Ta'al [Ibrahim SARSUR]
United Torah Judaism or UTJ [Yaakov LITZMAN] (a conglomerate of three parties)
Yesh Atid [Yair LAPID]
Yisrael Beiteinu or YB [Avigdor LIEBERMAN]
Political pressure groups and leaders: B'Tselem [Jessica MONTELL, Executive Director] monitors human rights abuses
Diplomatic representation in the US: chief of mission:Ambassador Ron DERMER (since 3 December 2013)
chancery:3514 International Drive NW, Washington, DC 20008
telephone:[1] (202) 364-5500
FAX:[1] (202) 364-5647
consulate(s) general:Atlanta, Boston, Chicago, Houston, Los Angeles, Miami, New York, Philadelphia, San Francisco
Diplomatic representation from the US: chief of mission:Ambassador Daniel B. SHAPIRO (since 8 July 2011)
embassy:71 Hayarkon Street, Tel Aviv 63903
telephone:[972] (3) 519-7475
FAX:[972] (3) 516-4390
consulate(s) general:Jerusalem; note - an independent US mission, established in 1928, whose members are not accredited to a foreign government
Flag description: white with a blue hexagram (six-pointed linear star) known as the Magen David (Star of David or Shield of David) centered between two equal horizontal blue bands near the top and bottom edges of the flag; the basic design resembles a traditional Jewish prayer shawl (tallit), which is white with blue stripes; the hexagram as a Jewish symbol dates back to medieval times
National symbol(s): Star of David (Magen David)
National anthem: name:'Hatikvah' (The Hope)
lyrics/music:Naftali Herz IMBER/traditional, arranged by Samuel COHEN
note:adopted 2004, unofficial since 1948; used as the anthem of the Zionist movement since 1897; the 1888 arrangement by Samuel COHEN is thought to be based on the Romanian folk song 'Carul cu boi' (The Ox Driven Cart)
Economy
Economy - overview:
Israel has a technologically advanced market economy. Cut diamonds, high-technology equipment, and pharmaceuticals are among the leading exports. Its major imports include crude oil, grains, raw materials, and military equipment. Israel usually posts sizable trade deficits, which are covered by tourism and other service exports, as well as significant foreign investment inflows. Between 2004 and 2011, growth averaged nearly 5% per year, led by exports. The global financial crisis of 2008-09 spurred a brief recession in Israel, but the country entered the crisis with solid fundamentals, following years of prudent fiscal policy and a resilient banking sector. In 2010, Israel formally acceded to the OECD. Israel's economy also has weathered the Arab Spring because strong trade ties outside the Middle East have insulated the economy from spillover effects. The economy has recovered better than most advanced, comparably sized economies, but slowing demand domestically and internationally, and a strong shekel, have reduced forecasts for the next decade to the 3% level. Natural gas fields discovered off Israel's coast since 2009 have brightened Israel's energy security outlook. The Tamar and Leviathan fields were some of the world's largest offshore natural gas finds this past decade. The massive Leviathan field is not due to come online until 2018, but production from Tamar provided a one percentage point boost to Israel's GDP in 2013 and is expected to contribute 0.5% growth in 2014. In mid-2011, public protests arose around income inequality and rising housing and commodity prices. Israel's income inequality and poverty rates are among the highest of OECD countries and there is a broad perception among the public that a small number of 'tycoons' have a cartel-like grip over the major parts of the economy. The government formed committees to address some of the grievances but has maintained that it will not engage in deficit spending to satisfy populist demands. In May 2013 the Israeli government, in a politically difficult process, passed an austerity budget to reign in the deficit and restore confidence in the government's fiscal position. Over the long term, Israel faces structural issues, including low labor participation rates for its fastest growing social segments - the ultra-orthodox and Arab-Israeli communities. Also, Israel's progressive, globally competitive, knowledge-based technology sector employs only 9% of the workforce, with the rest employed in manufacturing and services - sectors which face downward wage pressures from global competition.
GDP (purchasing power parity):
$273.2 billion (2013 est.)
country comparison to the world: 49
$264.5 billion (2012 est.)
$255.9 billion (2011 est.)
note:data are in 2013 US dollars
GDP (official exchange rate):
$272.7 billion (2013 est.)
GDP - real growth rate:
3.3% (2013 est.)
country comparison to the world: 104
3.4% (2012 est.)
4.6% (2011 est.)
GDP - per capita (PPP):
$36,200 (2013 est.)
country comparison to the world: 37
$34,300 (2012 est.)
$34,000 (2011 est.)
note:data are in 2013 US dollars
Gross national saving:
22.2% of GDP (2013 est.)
country comparison to the world: 68
21% of GDP (2012 est.)
21.4% of GDP (2011 est.)
GDP - composition, by end use: household consumption:56.1%
government consumption:22.7%
investment in fixed capital:19.6%
investment in inventories:0.7%
exports of goods and services:34.4%
imports of goods and services:-33.5%
(2013 est.)
GDP - composition, by sector of origin: agriculture:2.4%
high-technology products (including aviation, communications, computer-aided design and manufactures, medical electronics, fiber optics), wood and paper products, potash and phosphates, food, beverages, and tobacco, caustic soda, cement, construction, metal products, chemical products, plastics, cut diamonds, textiles, footwear
Industrial production growth rate:
5.5% (2013 est.)
country comparison to the world: 52 Labor force:
3.493 million (2013 est.)
country comparison to the world: 97
Labor force - by occupation: agriculture:1.6%
industry:18.1%
services:80.3% (2012 est.)
Unemployment rate:
5.8% (2013 est.)
country comparison to the world: 56
6.8% (2012 est.)
Population below poverty line:
21%
Household income or consumption by percentage share: lowest 10%:2.5%
highest 10%:24.3% (2008)
Distribution of family income - Gini index:
37.6 (2012)
country comparison to the world: 75
39.2 (2008)
Budget: revenues:$109.7 billion
expenditures:$113.9 billion (2013 est.)
Taxes and other revenues:
40.2% of GDP (2013 est.)
country comparison to the world: 40 Budget surplus (+) or deficit (-):
-1.5% of GDP (2013 est.)
country comparison to the world: 72
Public debt:
67.1% of GDP (2013 est.)
country comparison to the world: 41
66.9% of GDP (2012 est.)
Fiscal year:
calendar year
Inflation rate (consumer prices):
1.7% (2013 est.)
country comparison to the world: 55
1.7% (2012 est.)
Central bank discount rate:
1% (31 December 2013 est.)
country comparison to the world: 117
1.75% (31 December 2012 est.)
Commercial bank prime lending rate:
3.8% (31 December 2013 est.)
country comparison to the world: 151
5.16% (31 December 2012 est.)
Stock of narrow money:
$37.09 billion (31 December 2013 est.)
country comparison to the world: 55
$32.48 billion (31 December 2012 est.)
Stock of broad money:
$151.2 billion (31 December 2013 est.)
country comparison to the world: 46
$136.2 billion (31 December 2012 est.)
Stock of domestic credit:
$207.7 billion (31 December 2013 est.)
country comparison to the world: 40
$192.3 billion (31 December 2012 est.)
Market value of publicly traded shares:
$148.4 billion (31 December 2012 est.)
Current account balance:
$5.259 billion (2013 est.)
country comparison to the world: 30
$609 million (2012 est.)
Exports:
$60.67 billion (2013 est.)
country comparison to the world: 55
$62.32 billion (2012 est.)
Exports - commodities:
machinery and equipment, software, cut diamonds, agricultural products, chemicals, textiles and apparel
Exports - partners:
US 27.8%, Hong Kong 7.7%, UK 5.7%, Belgium 4.6%, China 4.3% (2012)
Imports:
$67.03 billion (2013 est.)
country comparison to the world: 44
$71.67 billion (2012 est.)
Imports - commodities:
raw materials, military equipment, investment goods, rough diamonds, fuels, grain, consumer goods
Imports - partners:
US 12.9%, China 7.3%, Germany 6.3%, Switzerland 5.5%, Belgium 4.8% (2012)
Reserves of foreign exchange and gold:
$80.74 billion (31 December 2013 est.)
country comparison to the world: 28
$75.91 billion (31 December 2012 est.)
Debt - external:
$96.3 billion (31 December 2013 est.)
country comparison to the world: 49
$93.98 billion (31 December 2012 est.)
Stock of direct foreign investment - at home:
$86.04 billion (31 December 2013 est.)
country comparison to the world: 43
$75.94 billion (31 December 2012 est.)
Stock of direct foreign investment - abroad:
$80.85 billion (31 December 2013 est.)
country comparison to the world: 31
$74.75 billion (31 December 2012 est.)
Exchange rates:
new Israeli shekels (ILS) per US dollar -
3.621 (2013 est.)
3.8559 (2012 est.)
3.739 (2010 est.)
3.93 (2009)
3.588 (2008)
Energy
Electricity - production:
55.77 billion kWh (2011 est.)
country comparison to the world:48
Electricity - consumption:
48.73 billion kWh (2010 est.)
country comparison to the world: 48
Electricity - exports:
4.224 billion kWh (2011 est.)
country comparison to the world: 30
Electricity - imports:
0 kWh (2012 est.)
country comparison to the world: 157
Electricity - installed generating capacity:
15.33 million kW (2010 est.)
country comparison to the world: 46
Electricity - from fossil fuels:
98.1% of total installed capacity (2010 est.)
country comparison to the world: 57
Electricity - from nuclear fuels:
0% of total installed capacity (2010 est.)
country comparison to the world: 110
Electricity - from hydroelectric plants:
0% of total installed capacity (2010 est.)
country comparison to the world: 176
Electricity - from other renewable sources:
1.8% of total installed capacity (2010 est.)
country comparison to the world: 75
Crude oil - production:
5,839 bbl/day (2012 est.)
country comparison to the world: 96
Crude oil - exports:
0 bbl/day (2010 est.)
country comparison to the world: 131
Crude oil - imports:
260,600 bbl/day (2010 est.)
country comparison to the world: 27
Crude oil - proved reserves:
11.5 million bbl (1 January 2013 est.)
country comparison to the world: 90
Refined petroleum products - production:
278,400 bbl/day (2010 est.)
country comparison to the world: 45
Refined petroleum products - consumption:
238,400 bbl/day (2011 est.)
country comparison to the world: 53
Refined petroleum products - exports:
83,700 bbl/day (2010 est.)
country comparison to the world: 47
Refined petroleum products - imports:
56,420 bbl/day (2010 est.)
country comparison to the world: 65
Natural gas - production:
6.86 billion cu m (2013 est.)
country comparison to the world: 49
Natural gas - consumption:
6.86 billion cu m (2013 est.)
country comparison to the world: 54
Natural gas - exports:
0 cu m (2011 est.)
country comparison to the world: 120
Natural gas - imports:
720 million cu m (2011 est.)
country comparison to the world: 63
Natural gas - proved reserves:
268.5 billion cu m (1 January 2013 est.)
country comparison to the world: 43
Carbon dioxide emissions from consumption of energy:
72.1 million Mt (2011 est.)
Communications
Telephones - main lines in use:
3.594 million (2012)
country comparison to the world:44
Telephones - mobile cellular:
9.225 million (2012)
country comparison to the world: 84
Telephone system:
general assessment:most highly developed system in the Middle East
domestic:good system of coaxial cable and microwave radio relay; all systems are digital; four privately owned mobile-cellular service providers with countrywide coverage
international:country code - 972; submarine cables provide links to Europe, Cyprus, and parts of the Middle East; satellite earth stations - 3 Intelsat (2 Atlantic Ocean and 1 Indian Ocean) (2011)
Broadcast media:
state broadcasting network, operated by the Israel Broadcasting Authority (IBA), broadcasts on 2 channels, one in Hebrew and the other in Arabic; 5 commercial channels including a channel broadcasting in Russian, a channel broadcasting Knesset proceedings, and a music channel supervised by a public body; multi-channel satellite and cable TV packages provide access to foreign channels; IBA broadcasts on 8 radio networks with multiple repeaters and Israel Defense Forces Radio broadcasts over multiple stations; about 15 privately owned radio stations; overall more than 100 stations and repeater stations (2008)
Internet country code:
.il
Internet hosts:
2.483 million (2012)
country comparison to the world: 36
Internet users:
4.525 million (2009)
country comparison to the world: 51
Transportation
Airports
47 (2013)
country comparison to the world:95
Airports - with paved runways total:29
over 3,047 m:2
2,438 to 3,047 m:5
1,524 to 2,437 m:6
914 to 1,523 m:11
under 914 m:5 (2013)
Airports - with unpaved runways total:18
1,524 to 2,437 m:1
914 to 1,523 m:3
under 914 m:
14 (2013)
Heliports 3 (2013)
Pipelines gas 763 km; oil 442 km; refined products 261 km (2013)
Railways total:975 kmcountry comparison to the world: 89
standard gauge:975 km 1.435-m gauge (2008)
Roadways total:18,566 kmcountry comparison to the world: 115
paved:18,566 km (includes 449 km of expressways) (2011)
Merchant marine total:8country comparison to the world: 120
by type:cargo 1, container 7
registered in other countries:48 (Bermuda 3, Georgia 1, Honduras 1, Liberia 34, Malta 3, Moldova 2, Panama 1, Saint Vincent and the Grenadines 3) (2010)
Ports and terminals major seaport(s):Ashdod, Elat (Eilat), Hadera, Haifa
Military branches Israel Defense Forces (IDF), Israel Naval Force (IN), Israel Air Force (IAF) (2010)
Military service age and obligation 18 years of age for compulsory (Jews, Druzes) military service; 17 years of age for voluntary (Christians, Muslims, Circassians) military service; both sexes are obligated to military service; conscript service obligation - 36 months for enlisted men, 21 months for enlisted women, 48 months for officers; pilots commit to 9 years service; reserve obligation to age 41-51 (men), 24 (women) (2013)
Manpower available for military service males age 16-49:1,797,960
females age 16-49:1,713,230 (2010 est.)
Manpower fit for military service males age 16-49:1,517,510
females age 16-49:1,446,132 (2010 est.)
Manpower reaching militarily significant age annually male:62,304
female:59,418 (2010 est.)
Military expenditures
5.69% of GDP (2012)
country comparison to the world: 4
5.87% of GDP (2011)
5.69% of GDP (2010)
Transnational Issues
Disputes - international West Bank and Gaza Strip are Israeli-occupied with current status subject to the Israeli-Palestinian Interim Agreement - permanent status to be determined through further negotiation; Israel continues construction of a 'seam line' separation barrier along parts of the Green Line and within the West Bank; Israel withdrew its settlers and military from the Gaza Strip and from four settlements in the West Bank in August 2005; Golan Heights is Israeli-occupied (Lebanon claims the Shab'a Farms area of Golan Heights); since 1948, about 350 peacekeepers from the UN Truce Supervision Organization headquartered in Jerusalem monitor ceasefires, supervise armistice agreements, prevent isolated incidents from escalating, and assist other UN personnel in the region
Refugees and internally displaced persons refugees (country of origin):34,988 (Eritrea); 12,926 (Sudan) (2013)
stateless persons:14 (2012)
Illicit drugs increasingly concerned about ecstasy, cocaine, and heroin abuse; drugs arrive in country from Lebanon and, increasingly, from Jordan; money-laundering center